A technique used in molecular biology for the detection of mutations, polymorphisms and epigenetic differences in DNA samples.
What is HRM analysis?
HRM (high resolution melting) analysis is a post-PCR analysis method used to identify genetic variation in nucleic acid sequences. This simple and rapid method is based on PCR melting (dissociation) curve techniques. HRM analysis can discriminate DNA sequences on the basis of their composition, length, GC content or strand complementarity.
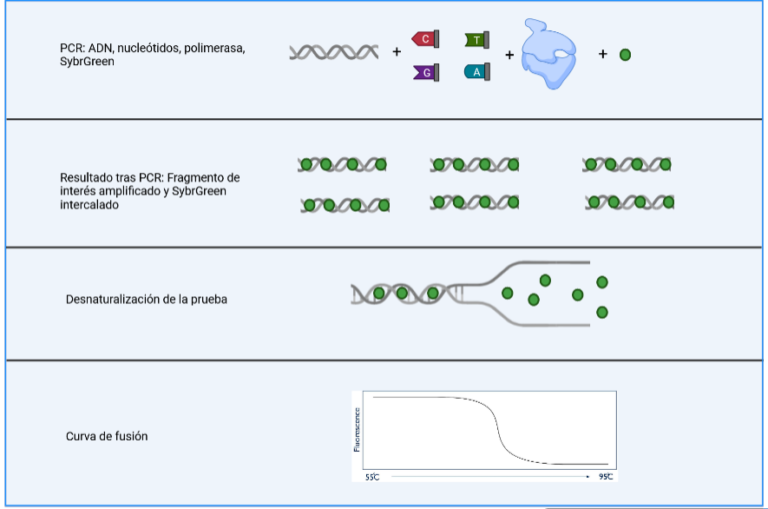
At the beginning of the HRM analysis there is a PCR (polymerase chain reaction) to amplify the DNA region where the mutation, polymorphism or epigenetic difference of interest is located. In addition to the typical ingredients of any PCR (nucleotides, polymerase, magnesium), this PCR includes a fluorescent agent (e.g. SybrGreen) that is inserted into the double-stranded DNA during amplification. Once the PCR is finished, there are now many copies of the DNA region of interest (known as amplicon) in the sample tube.
Protocol for HRM (high resolution melting). After PCR, the sample is precisely heated (denaturation). The variation in the fluorescence of the sample is recorded in a curve that allows interpretation of the results.
Now begins the HRM analysis itself, which involves precise heating of the DNA in the sample from about 50˚C to about 95˚C. At some point in this process, the melting temperature of each of the amplicons in the sample is reached and the two strands of DNA separate.
The key to HRM analysis is to monitor the separation of the two DNA strands in real time. For this purpose, different fluorescent substances are currently available that intercalate into the double-stranded DNA and when bound to it emit high fluorescence. When they are in solution (not bound to the DNA) they emit a low fluorescence.
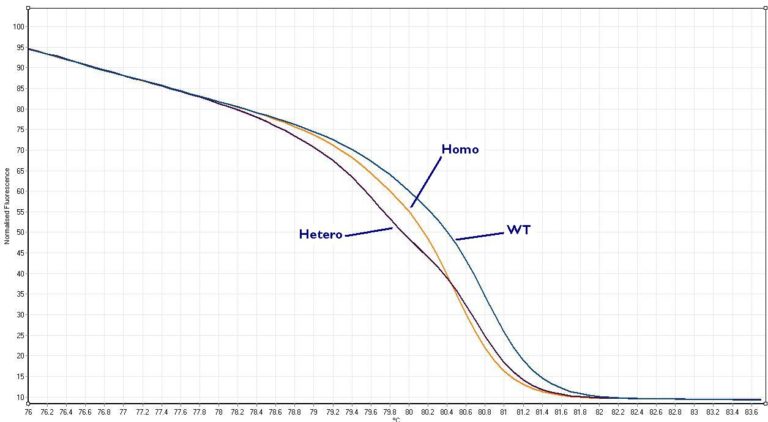
Example of a melting curve from an HRM analysis. The graph demonstrates the sharp decrease in fluorescence when double-stranded DNA is melted into its single-stranded form.
At the beginning of the HRM analysis there is a high level of fluorescence in the sample because many of these fluorescent molecules are bound to the billions of copies of the amplicon (of the amplicons).
As the sample is heated and the two strands of DNA separate, the presence of double-stranded DNA decreases, the fluorescent molecules go back into solution and therefore the fluorescence decreases. This decrease in fluorescence starts slowly, but when the double-stranded DNA transitions to its single-stranded form, an abrupt decrease in fluorescence is detected. This decrease is usually greatest near the melting temperature (Tm) of the amplicon (of amplicons). The Tm is defined as the point on the melting curve at which 50% of the DNA is double-stranded and 50% is single-stranded.
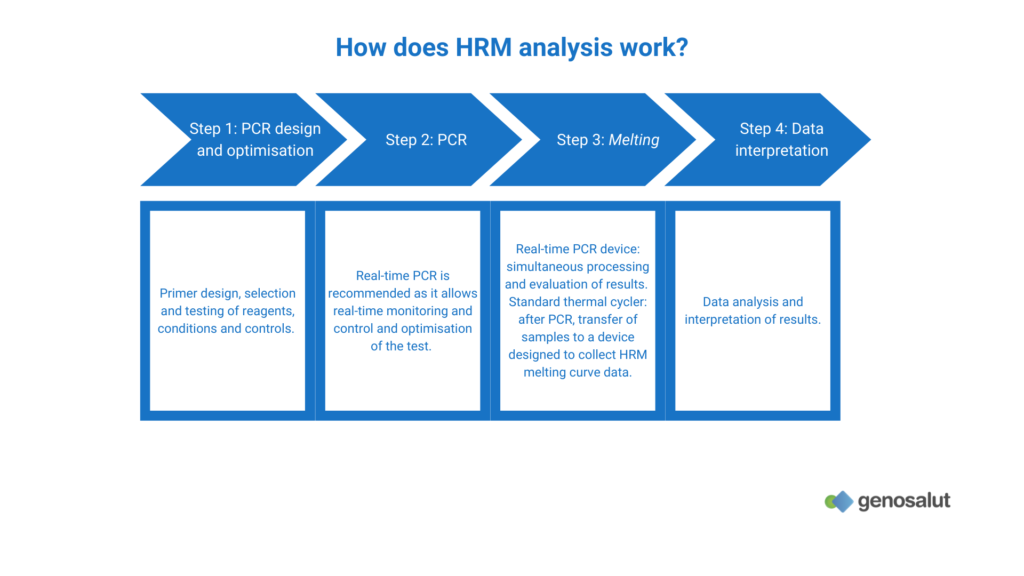
The HRM device has a system capable of measuring the fluorescence of the sample and software that allows the detected data to be plotted on a graph known as a melting curve, which shows the level of fluorescence versus temperature.
The resulting melting profile reflects the mixture of amplicons present. Aspects such as GC content, length, sequence and heterozygosity will add to the melting curve characteristics of each amplicon. The resulting profiles can provide valuable information for mutation screening, genotyping, methylation and other research applications.
Do you have questions about our technologies and services?
CÓMO PROTEGER TU PRIVACIDAD
Usamos cookies en nuestro sitio web para brindarle la experiencia más relevante recordando sus preferencias y visitas repetidas. Al hacer clic en "Aceptar todo", acepta el uso de todas las cookies. Puede visitar "Configuración de cookies" para proporcionar un consentimiento controlado o rechazarlas todas en "Rechazar todo". Para más información, consulta nuestra "Política de privacidad".
Este sitio web utiliza cookies para mejorar su experiencia mientras navega por el sitio web. De estas, las cookies que se clasifican como necesarias se almacenan en su navegador, ya que son esenciales para el funcionamiento de las funcionalidades básicas del sitio web. También utilizamos cookies de terceros que nos ayudan a analizar y comprender cómo utiliza este sitio web. Estas cookies se almacenarán en su navegador solo con su consentimiento. También tiene la opción de optar por no recibir estas cookies. Pero la exclusión voluntaria de algunas de estas cookies puede afectar su experiencia de navegación.